How often do NAS hard drives actually go on sale?
We measured it from daily price history: consumer NAS drives go on sale several times more often than enterprise drives, though the discount is about the same size when it happens. Here's the data, by tier and by model.
Everyone knows drives "go on sale," but nobody seems to know how often. Is it worth holding out for a discount on a WD Red, or does that drive basically never move? Does an enterprise Exos ever drop, or is the list price the price? So we measured it, drive by drive, from the daily price history.
The idea is simple. For each drive, compare every day's best price to its own recent baseline - the price it normally sits at that month. When the price dips a real amount below that baseline and then recovers, that's a sale. Count how often it happens, and how far the price falls. Do that across every in-production 8TB-and-up NAS drive and split it into the two tiers people choose between, and a clear pattern shows up.
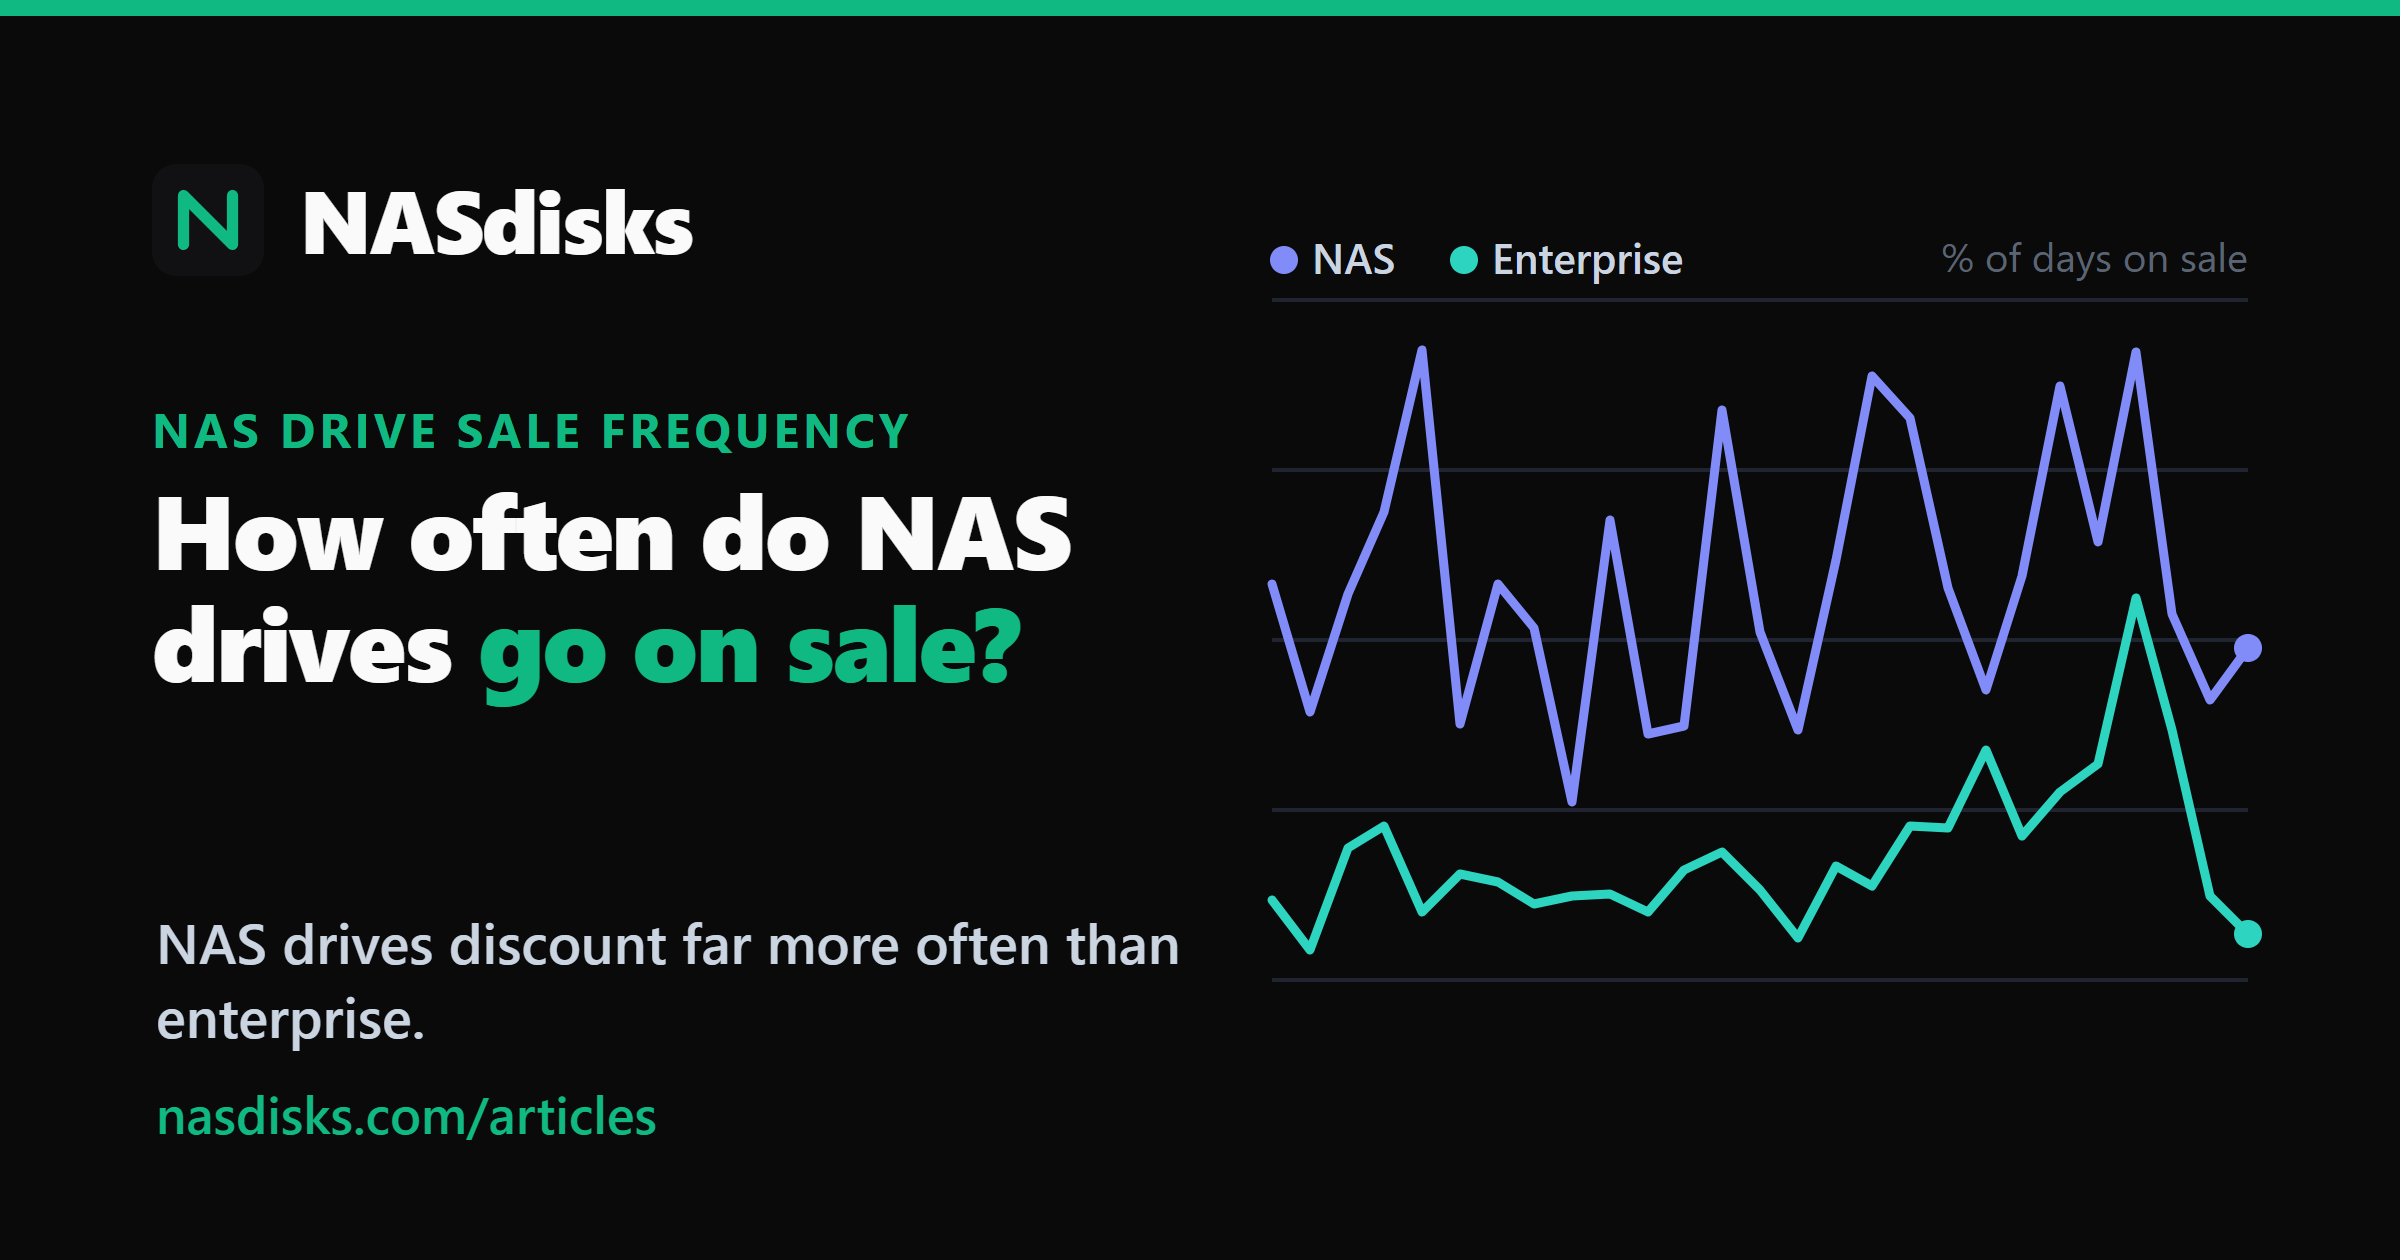
The consumer line sits above the enterprise line in almost every single month. Consumer NAS drives - the WD Red and Seagate IronWolf class - are on sale a meaningful share of the time, with visible spikes around the usual sale seasons. Enterprise drives spend most of the time flat at list.
Consumer drives go on sale far more often
Across the whole window, a typical consumer NAS drive is on sale roughly one day in ten. A typical enterprise drive is on sale closer to one day in forty. That's nearly four times as often for consumer drives - a large, consistent gap, not a one-month fluke.
That matches how these drives are sold. Consumer NAS drives move through normal retail, where Amazon and the manufacturers run frequent promotions, price-match, and lightning deals. Enterprise drives are priced for volume buyers and channel partners; the retail listing you see is closer to a fixed number that moves in steps, not a price that dips for a weekend and bounces back.
Which models discount the most
The tier average hides a lot of spread. Some drives go on sale constantly; others almost never do. Sorted most-discounted first:
| Drive | Tier | On sale % of days |
Typical discount |
Deepest seen |
Sale events |
|---|---|---|---|---|---|
| Seagate IronWolf 10TB | Consumer | 9.9% | 12.6% | 32.8% | 20 |
| Toshiba N300 8TB | Consumer | 9.0% | 9.8% | 22.7% | 10 |
| WD Ultrastar DC HC590 26TB | Enterprise | 8.9% | 6.6% | 11.9% | 4 |
| WD Gold 20TB | Enterprise | 8.5% | 17.9% | 32.3% | 6 |
| WD Red Plus 8TB | Consumer | 7.5% | 14.3% | 30.1% | 7 |
| Seagate IronWolf Pro 20TB | Consumer | 7.3% | 7.2% | 19.2% | 15 |
| Seagate IronWolf 12TB | Consumer | 6.7% | 8.2% | 22.7% | 14 |
| Seagate IronWolf Pro 16TB | Consumer | 6.7% | 11.7% | 20.7% | 8 |
| Seagate Exos 7E8 8TB | Enterprise | 6.6% | 17.8% | 58.5% | 8 |
| Toshiba MG06 10TB | Enterprise | 6.5% | 9.5% | 24.2% | 10 |
| WD Red Pro 14TB | Consumer | 6.3% | 7.6% | 22.8% | 14 |
| Toshiba MG10 20TB | Enterprise | 6.3% | 5.8% | 15.3% | 25 |
| WD Gold 14TB | Enterprise | 5.6% | 7.1% | 33.5% | 10 |
| Seagate Exos X20 20TB | Enterprise | 5.6% | 9.1% | 51.1% | 15 |
| Seagate Exos X18 18TB | Enterprise | 5.6% | 15.3% | 70.9% | 11 |
| Toshiba N300 12TB | Consumer | 5.6% | 7.8% | 23.0% | 9 |
| Seagate Exos X16 16TB | Enterprise | 5.4% | 22.7% | 45.5% | 12 |
| Seagate Exos X16 16TB | Enterprise | 5.3% | 11.9% | 34.5% | 11 |
| Seagate IronWolf Pro 10TB | Consumer | 5.2% | 6.8% | 18.1% | 12 |
| WD Gold 24TB | Enterprise | 4.9% | 9.4% | 17.2% | 7 |
| Toshiba MG08 16TB | Enterprise | 4.9% | 23.8% | 23.8% | 3 |
| WD Red Pro 16TB | Consumer | 4.8% | 8.5% | 15.4% | 13 |
| WD Red Pro 22TB | Consumer | 4.8% | 8.5% | 25.8% | 11 |
| Seagate Exos 7E10 10TB | Enterprise | 4.7% | 6.3% | 37.8% | 15 |
| Toshiba N300 10TB | Consumer | 4.4% | 14.8% | 32.8% | 10 |
| Toshiba MG09 18TB | Enterprise | 4.4% | 7.6% | 16.7% | 12 |
| Seagate IronWolf Pro 24TB | Consumer | 4.3% | 14.8% | 16.7% | 8 |
| Toshiba N300 16TB | Consumer | 4.3% | 7.1% | 41.3% | 11 |
| WD Gold 12TB | Enterprise | 4.1% | 7.4% | 22.4% | 6 |
| Seagate Exos X18 18TB | Enterprise | 4.0% | 13.0% | 46.6% | 12 |
| WD Red Pro 10TB | Consumer | 3.7% | 11.3% | 34.5% | 5 |
| WD Ultrastar DC HC570 22TB | Enterprise | 3.6% | 31.6% | 31.6% | 1 |
| WD Gold 18TB | Enterprise | 3.3% | 9.8% | 17.4% | 8 |
| WD Ultrastar DC HC580 24TB | Enterprise | 3.3% | 6.7% | 15.1% | 13 |
| WD Ultrastar DC HC320 8TB | Enterprise | 3.2% | 16.1% | 34.8% | 9 |
| WD Gold 8TB | Enterprise | 2.9% | 7.9% | 30.3% | 4 |
| WD Ultrastar DC HC530 14TB | Enterprise | 2.9% | 45.2% | 58.9% | 3 |
| Seagate IronWolf 8TB | Consumer | 2.9% | 6.8% | 11.9% | 7 |
| Toshiba MG09 18TB | Enterprise | 2.8% | 7.0% | 9.4% | 8 |
| WD Red Plus 8TB | Consumer | 2.6% | 23.7% | 41.9% | 5 |
| WD Red Plus 12TB | Consumer | 2.5% | 8.4% | 43.5% | 5 |
| WD Red Plus 14TB | Consumer | 2.5% | 17.2% | 27.5% | 1 |
| Toshiba MG10 22TB | Enterprise | 2.5% | 6.2% | 14.3% | 10 |
| WD Gold 16TB | Enterprise | 2.4% | 9.2% | 28.0% | 5 |
| WD Ultrastar DC HC560 20TB | Enterprise | 2.4% | 7.0% | 49.6% | 9 |
| WD Gold 10TB | Enterprise | 2.2% | 8.3% | 18.1% | 8 |
| WD Gold 22TB | Enterprise | 2.1% | 8.0% | 15.9% | 6 |
| WD Red Pro 20TB | Consumer | 2.0% | 10.9% | 14.7% | 7 |
| WD Red Pro 12TB | Consumer | 1.9% | 11.8% | 21.0% | 2 |
| WD Red Pro 18TB | Consumer | 1.9% | 11.4% | 15.8% | 6 |
| WD Ultrastar DC HC330 10TB | Enterprise | 1.7% | 9.9% | 14.6% | 8 |
| Seagate IronWolf Pro 12TB | Consumer | 1.7% | 8.6% | 36.7% | 5 |
| Seagate IronWolf Pro 14TB | Consumer | 1.7% | 11.1% | 20.5% | 4 |
| WD Red Plus 10TB | Consumer | 1.6% | 9.7% | 34.9% | 6 |
| WD Red Pro 8TB | Consumer | 1.4% | 9.2% | 18.7% | 2 |
| Seagate IronWolf Pro 22TB | Consumer | 1.4% | 9.5% | 25.0% | 6 |
| Seagate Exos 7E10 8TB | Enterprise | 1.4% | 9.7% | 19.0% | 4 |
| Toshiba MG07 12TB | Enterprise | 1.4% | 7.6% | 55.3% | 3 |
| WD Ultrastar DC HC550 16TB | Enterprise | 1.4% | 18.9% | 19.7% | 2 |
| Toshiba MG11 24TB | Enterprise | 1.3% | 6.8% | 13.9% | 5 |
| Seagate IronWolf Pro 8TB | Consumer | 1.2% | 36.4% | 36.4% | 1 |
| Toshiba MG06 8TB | Enterprise | 1.0% | 29.9% | 29.9% | 2 |
| Toshiba MG07 14TB | Enterprise | 0.0% | 0.0% | 0.0% | 0 |
| Toshiba MG09 16TB | Enterprise | 0.0% | 0.0% | 0.0% | 0 |
A few things stand out reading down it. The Seagate IronWolf Pro line is the most sale-happy on the board - several of its capacities are on sale a large fraction of the time, so patience genuinely pays there. On the enterprise side, WD Gold is the outlier that discounts almost like a consumer drive, while Seagate Exos and WD Ultrastar barely move - for those, the list price really is the price most of the year.
If your shortlist includes a drive near the top of that table, waiting for a dip is a real strategy. If it's near the bottom, you're mostly waiting for nothing.
How deep are the discounts
Here's the part that surprises people: when a drive does go on sale, the size of the discount is about the same whether it's consumer or enterprise. A typical sale is around 10% off the drive's baseline, and the deepest dips reach roughly 30% off, occasionally more. Enterprise drives don't discount by a bigger amount to make up for discounting less often - they just discount less often.
So the tier difference is entirely about frequency, not depth. Consumer drives give you more chances at a similar-sized saving; enterprise drives give you fewer.
How to use this when buying
- Match your patience to the drive. If your pick is one of the frequently-discounted consumer models, it's worth waiting a week or two for a dip. If it's a rarely-discounted enterprise drive, holding out mostly costs you time.
- A "sale" is only a sale against that drive's own baseline. During the price crunch, the baseline itself climbed, so a headline "deal" can still be more than last year's regular price. Judge a discount against the drive's recent normal, which is exactly what this measures.
- Track real drops, not the sticker. Our deals feed flags genuine price drops off each drive's own recent history, biggest first - the same idea as this article, applied live.
- Buy on $/TB first. Sale frequency is a tiebreaker between drives you'd already buy, not a reason to pick a worse drive. Start from the full $/TB table and the best-value report, then use timing to shave a bit more.
Method
For each drive we take the best in-stock new price per day (US region), then compare each day to a centred rolling median of the drive's price over the surrounding few weeks. That rolling baseline is the drive's "normal" price at that moment, and because it's local it isn't fooled by the long price climb - a rising trend is not a sale. A day counts as on sale when its price sits at least 5% below that baseline; a "sale event" is a run of such days. We report the share of days on sale, the typical and deepest discount, and the number of events, per drive and per tier, across in-production 8TB+ NAS hard drives with enough history. Prices are compiled from Amazon price history; only in-stock new listings are counted, so recertified and refurbished drives are excluded. The per-model numbers in the table above are also a plain CSV: /data/sale-frequency.csv. The underlying level - what a terabyte actually costs - is in the $/TB crunch story, and you can explore every drive in the full table or the open dataset.